


Daily Brief: Nvidia is not the growth stock you're looking for.
Daily Brief: Nvidia is not the growth stock you're looking for.
Understanding the dip from their growth multiple and PE ratio.

Gold star to anyone who recognized the title reference:

Here’s our headline for today: Yesterday, the S&P 500 remained flat after Nvidia posted its second-quarter (Q2) earnings on Wednesday afternoon.
Here’s my big takeaway:
A company that skyrocketed to a $3.1 trillion valuation just lost $200 billion in a single day of trading — after beating the consensus estimates with over $30 billion in revenue and 15% quarter over quarter (Q/Q) growth.
That’s a crazy headline - we live in a world of meme stocks. You could read dozens, maybe even hundreds, of publications today editorializing about why Nvidia dropped. I’ll save you the suspense: this is not that type of newsletter.
This newsletter is all about understanding the money markets in the context of first principles. The only fundamental investing metrics you need to know are the following:
Market Cap: shorthand for “market capitalization”, this is the total value of “shares outstanding” (units of company stock available for the public to buy and sell), which gives roughly the market value of the business:
\(\text{Market Cap} = (\text{Share Price} )\times( \text{# of Shares})\)Quarterly Growth: the rate that revenue grows from quarter-to-quarter. Also commonly quoted for the earnings = revenue - costs.
P/E Ratio: “Price-to-earnings” ratio. A pure number formally defined as:
The denominator in the PE Ratio is usually abbreviated as EPS (Earnings Per Share) — but I personally find it much more intuitive to express the PE Ratio in terms of Market Cap divided by annual earnings (above on the right).
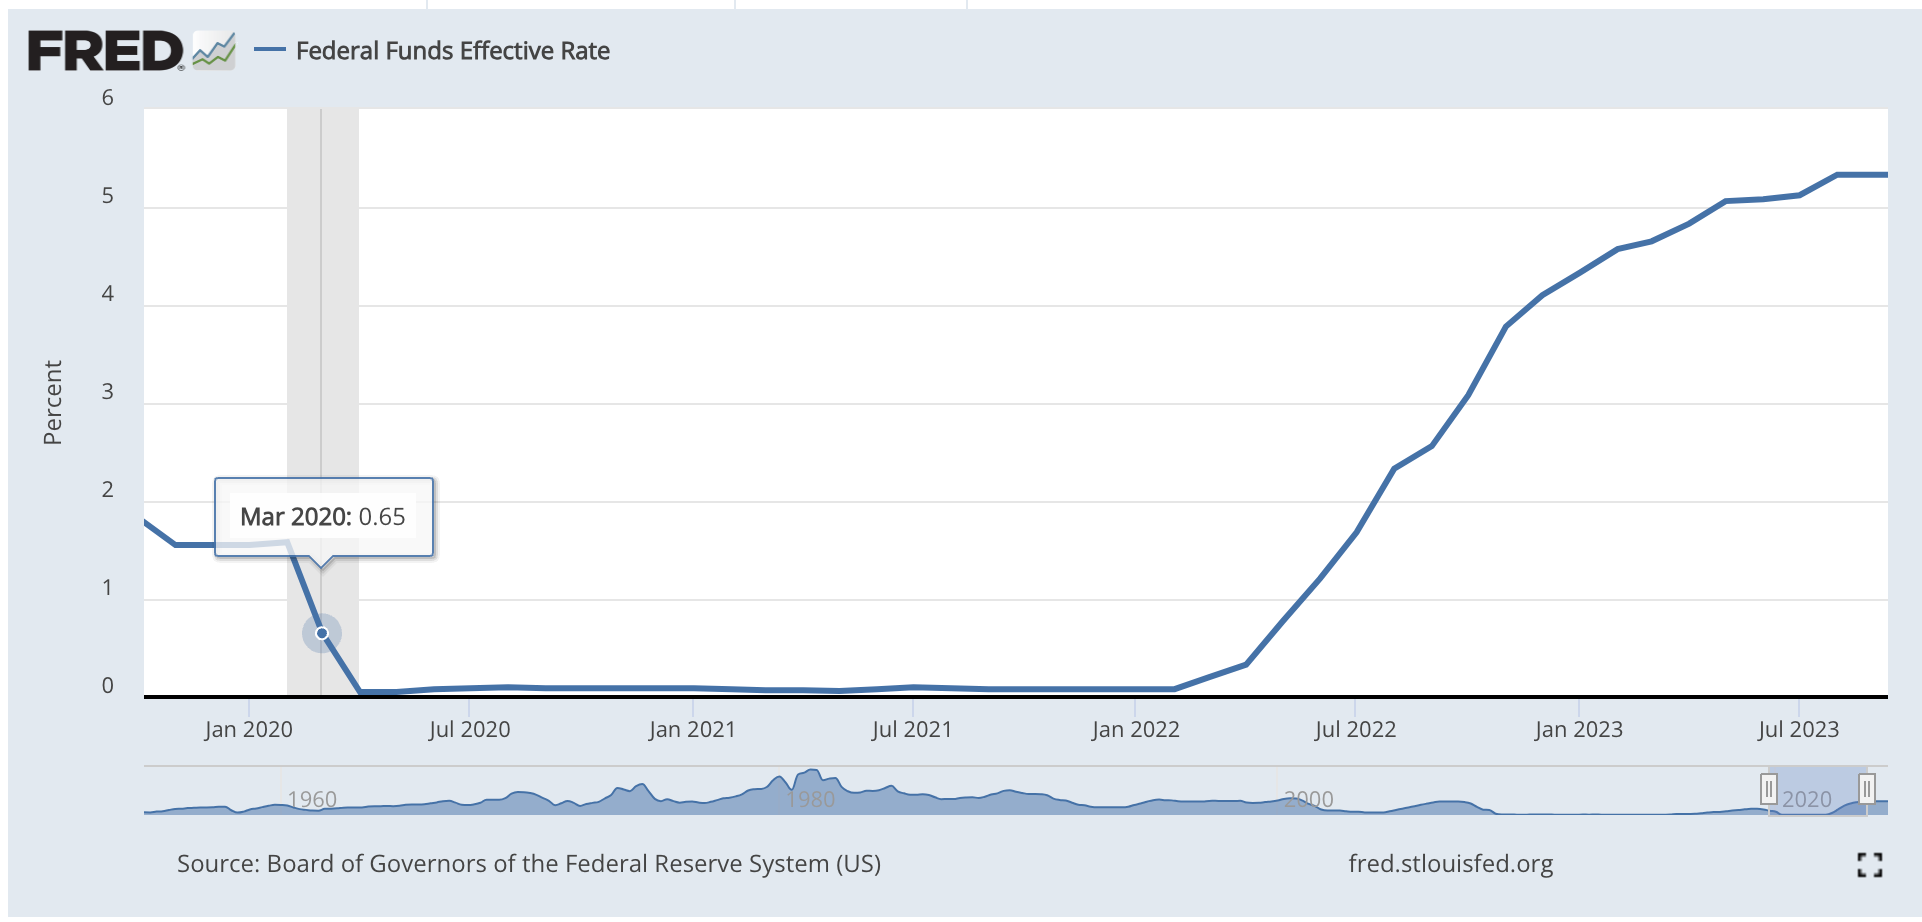
Below gives an overview of these metrics from the Q2 press release on Nvidia’s website:
Making sense of the headline:
Candidly, I had a hard time boxing my thoughts on this event — and there are over 530K people on StockTwits that probably have their own opinions. Indeed, there’s a lot to say from both a finance and business fundamentals perspective. On one hand, you have:
Finance answer: The growth rate does not support Nvidia’s P/E ratio.
Then there’s also the question about what runs the business engine for Nvidia:
Business answer: It’s not obvious where Nvidia goes from here, and competition in the AI data center space is around the corner.
In this Daily Brief, I’m going to address the finance answer. We’ll use the above metrics (Q/Q Growth and PE ratio) to help explain why the stock went down despite another strong quarter from Nvidia.
Then this weekend, I’m going to take more of a deep dive into the fundamentals of the business in our first Weekend Workshop, so we can better understand where the market cap will go in the next few years.
For today, let’s rewind to a pivotal moment when the Earth stood still:
March 15, 2020
No need to dwell on the details — I’ll just leave you with this gem from March 11th, 2020:

and then this headline on March 12th:

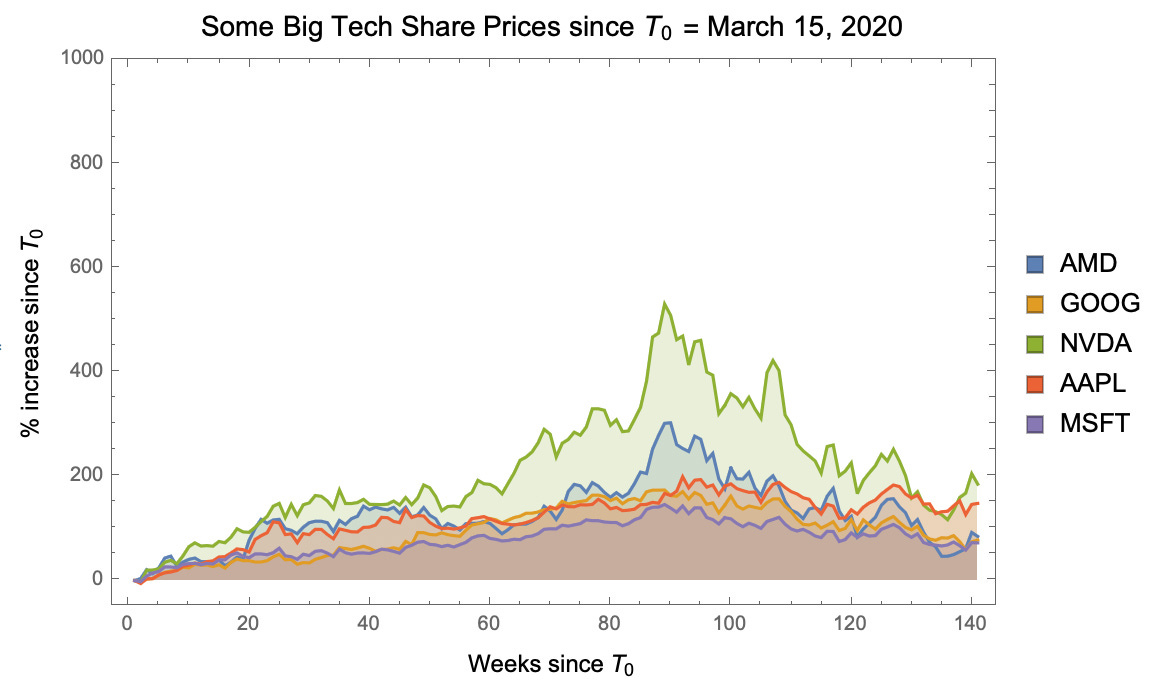
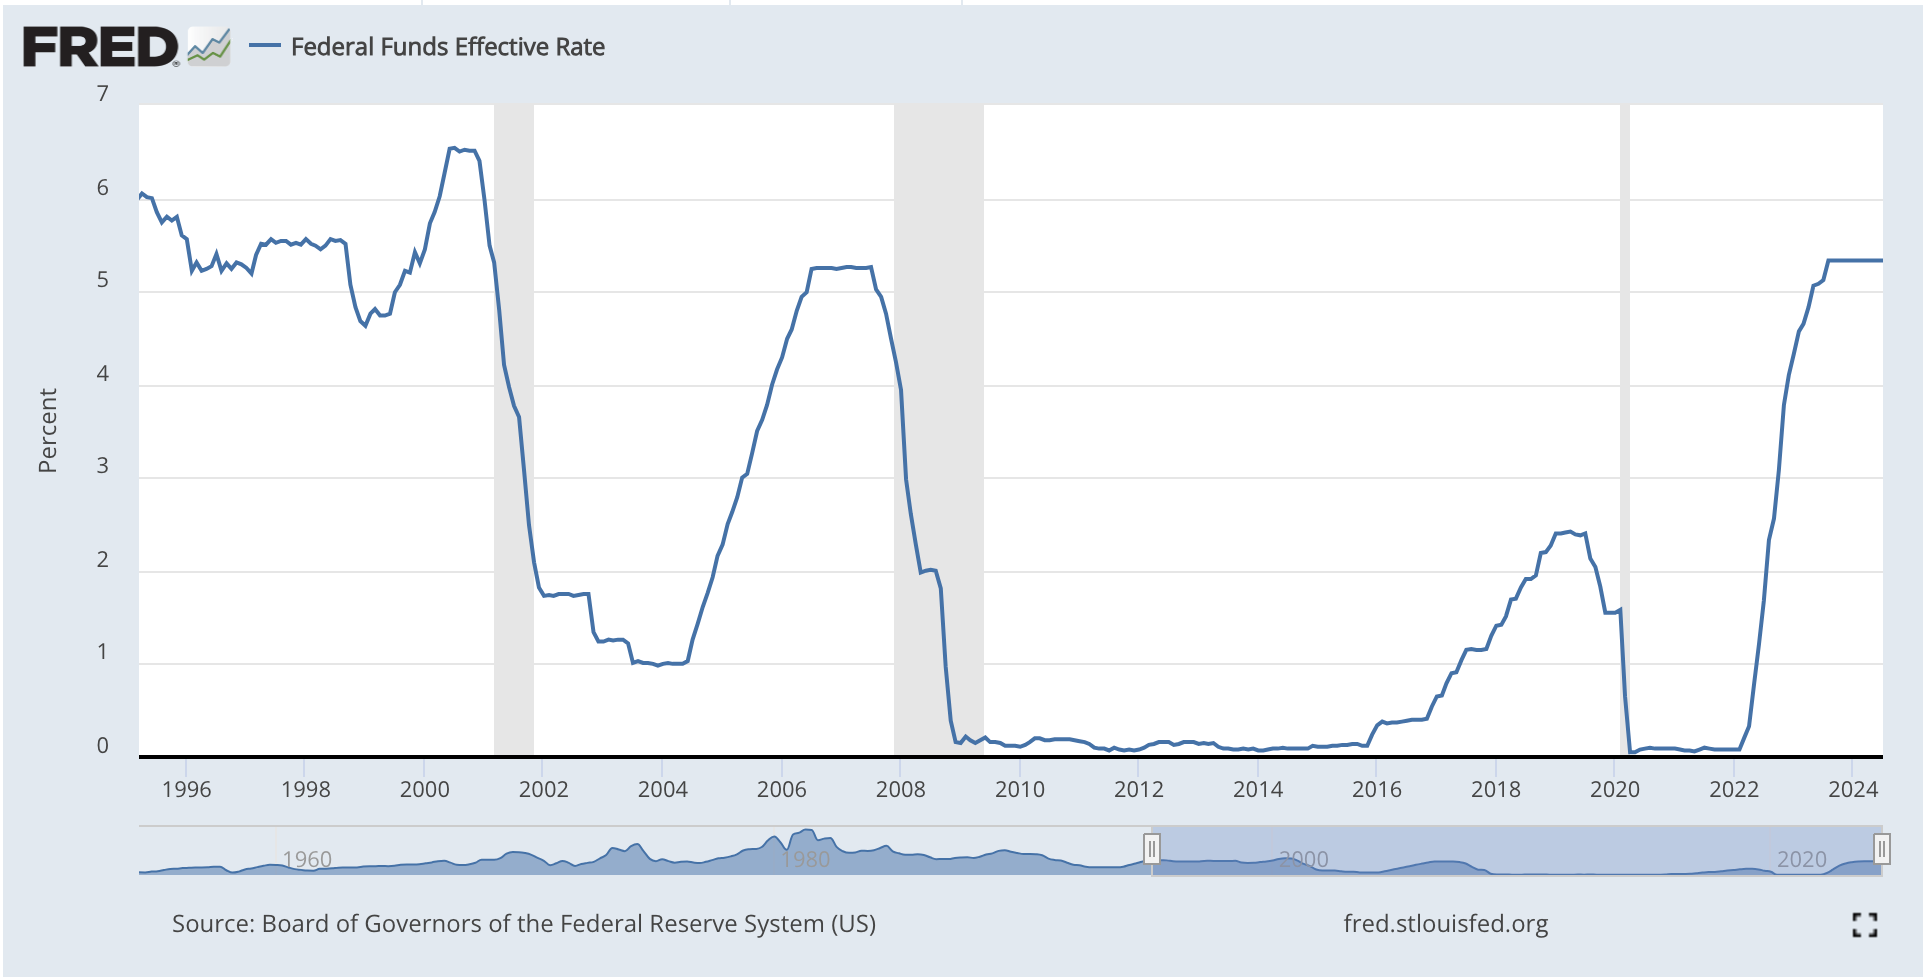
Then on March 15th, the world shut down and the Fed issued emergency rate cuts. The next two years was funny money for the global economy, where the cost of borrowing was essentially zero in order to help mitigate the human toll of a recession.
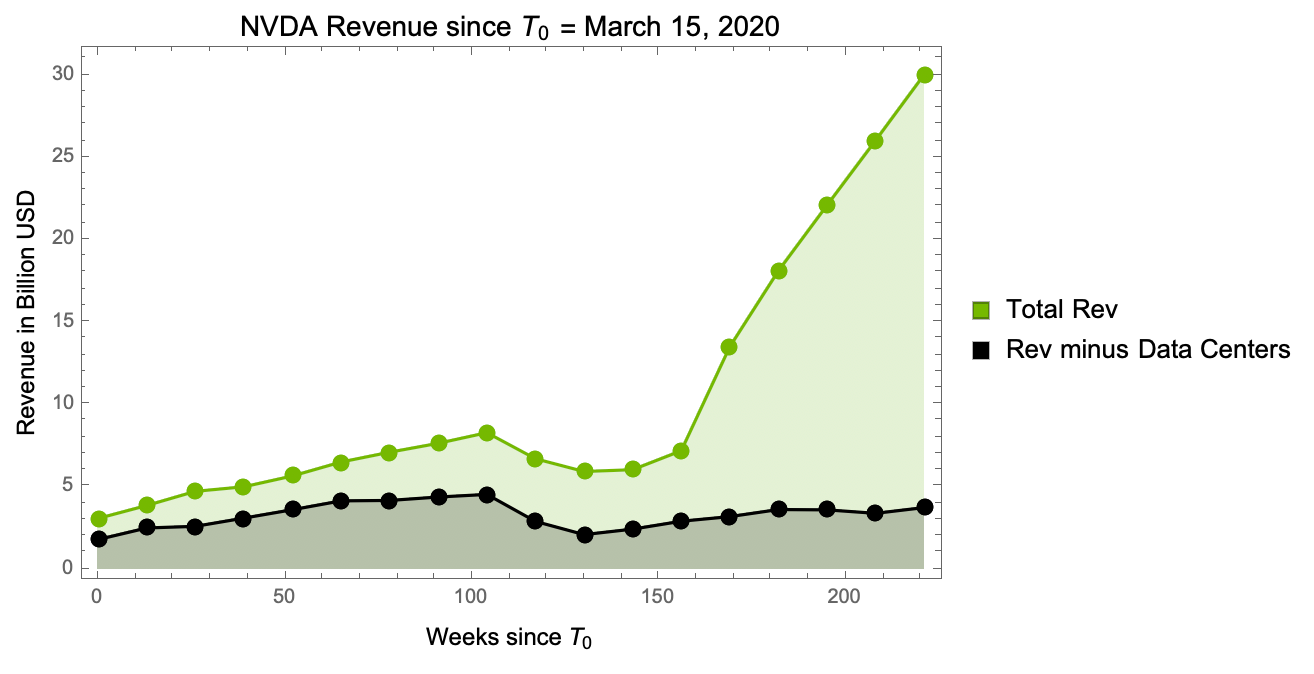
At this point, Nvidia was essentially just a fabless chip company - and they basically had two product lines:
Chips (GPUs) for research projects run on computing clusters held in data centers and
Chips (also GPUs) for low latency video gaming.
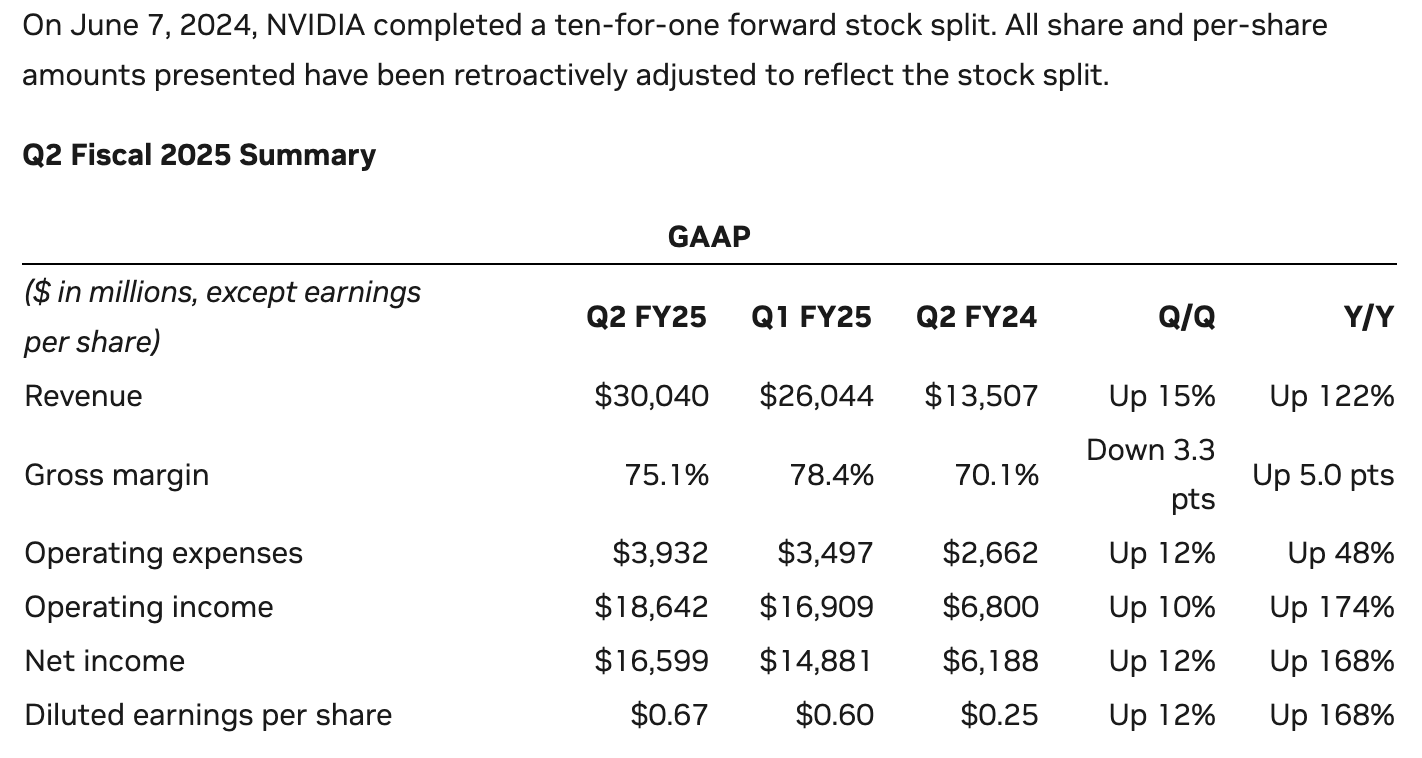
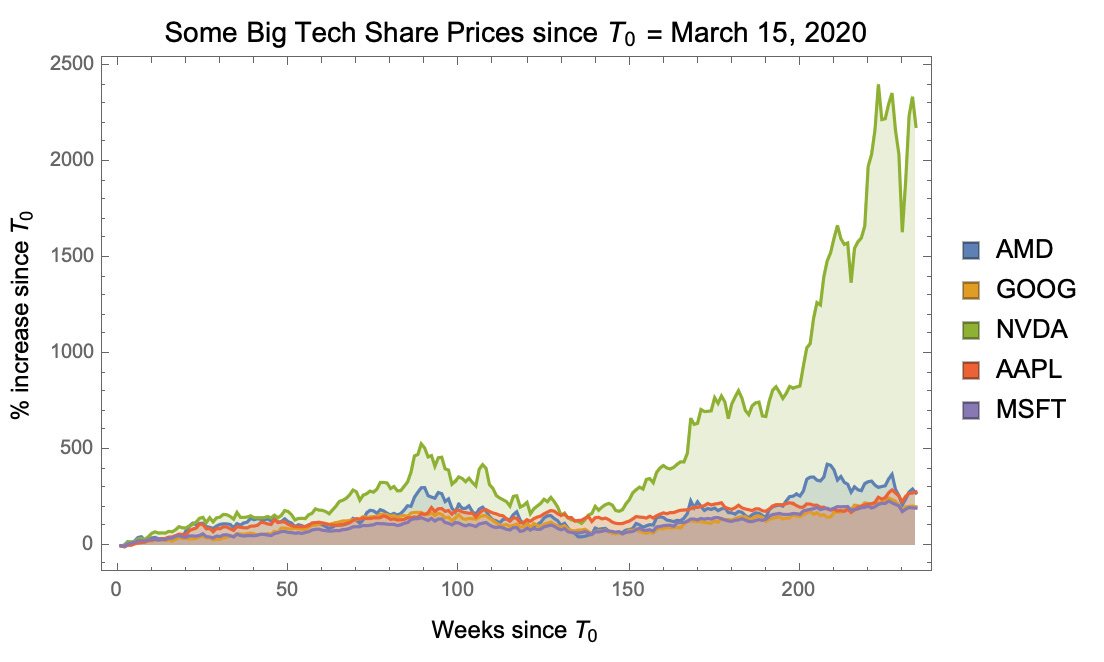
During this period, their revenue looked like this week-by-week:
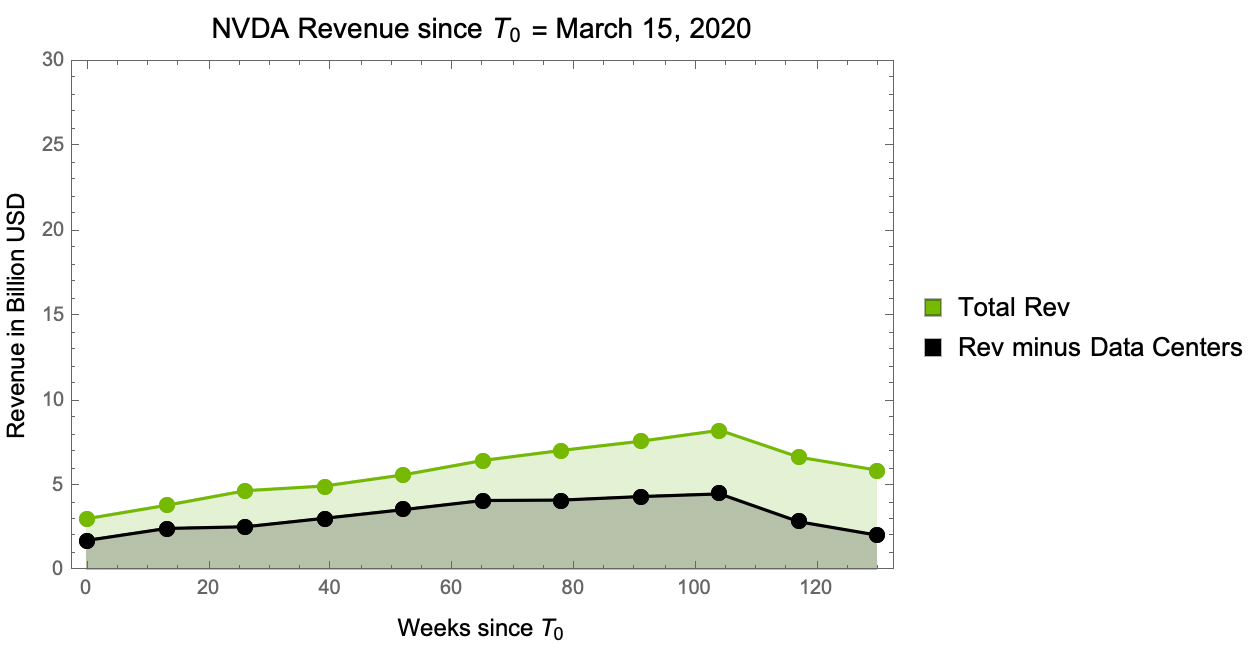
Over this same period of pretty typical revenue and earnings, this was the stock response:
The spike might seem material, but keep in mind that at this point there was a lot of talk about the CHIPS Act (which was eventually passed on August 9th, 2020 — week 125 of our chart), which generated significant hype for the US based fabless chip industry.
But what really drove the rise and fall of Tech from 2020 to 2022 is this:
Fed lowers rates, stocks go up. Fed raises rates, stocks go down. Nothing that crazy.
Then a Thanksgiving miracle happens for Nvidia — after Black Friday dust clears, and the consumer markets die down, the world wakes up to…
November 30, 2022
ChatGPT goes online, and everyone discovers that deep learning algorithms have become really really REALLY good at universal function approximation — so good that your personal computers can (1) write your college application essays, (2) pass the Turing Test, and (3) beat 50% of Harvard Law Students on the LSAT.
Overnight, the rise of Large Language Models (LLMs) becomes the next dot-com bubble - promising either utopia or apocalypse within the decade.
Since that day, this is how Nvidia has performed against the rest of the major tech players:
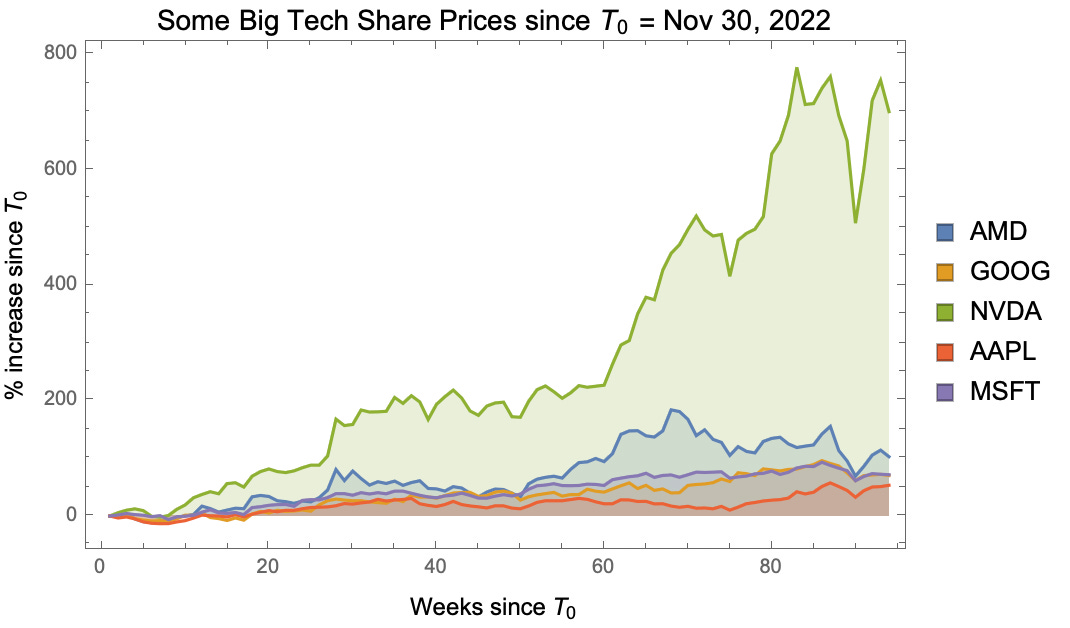
Lining up their quarterly earnings, we can see that something very peculiar happens when their 2023 Q1 earnings are released:
At this point, it becomes Common Knowledge that all the chips they were building for low latency (highly parallelized compute) for video games, is actually exactly what is needed to implement deep learning training algorithms, and have them run on human time scales.
Their market dominance in the video-gaming space, means that Nvidia now holds the shovels for the AI gold rush.
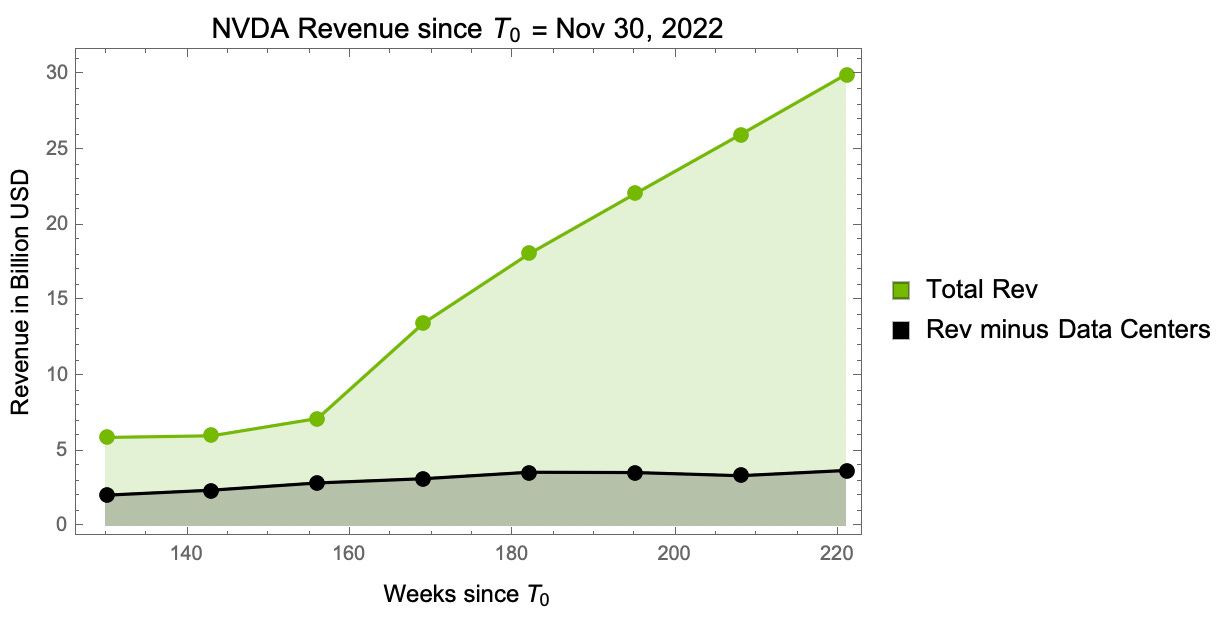
So this company, Nvidia, that was previously just a major player in supplying hardware for video games, has become the supplier for the GPU (Graphics Processing Units) based Data Center infrastructure. The revenue generated by this new AI market is shown above (the green area).
For those keeping track at home, below I’ve placed chart showing the full timeline of stock growth,
and revenue growth:
The rest is history.
Note that during this AI boom, the quarterly revenue has jumped 500%, whereas the market cap has jumped almost 1200%.
Keep these numbers in mind.
So why the dip yesterday, and where does NVDA go from here?
Obviously there are always myriad reasons for why stocks rise and fall on a given day — and most are completely unknowable. So it’s best not to get too caught up in the short-term stochastic (random) events.
But the Nvidia’s dip points to something that institutional investors likely already know about the current valuation:
Based on their PE Ratio, Nvidia is currently priced as a growth stock.
I’ll just define growth stocks as company shares that have much higher PE ratios relative to their competitors in the industry. So for example, Apple, Google, Microsoft, AMD, Amazon, etc. all have PE ratios of around 20 to 30 - this is characteristic of large tech companies.
In contrast, Nvidia’s P/E has been hopping around 60-80. In plain terms:
Based on the definition of P/E, this asymmetry makes a ton of sense.
The P/E ratio indicates the market value of a company relative to present earnings. The stock market is a forward looking machine that makes educated guesses about the future — so if you expect most of the earnings to be collected in the future (i.e. the company is growing FAST), then you want a stock price that captures that in the present market cap.
This asymmetry of future earnings compared to the present value will drive up the P/E ratio. Simple enough.
But there’s a problem.
PE Ratio goes with the Growth Rate, and Nvidia is plateauing — fast.
Last year when Nvidia was growing at 200+% year-over-year (20% to 30% quarter over quarter) it made a lot of sense to see PE ratios of 60-80 commensurate with the growth multiple.
But with the slowing demand for GPU data centers driven by the underwhelming productivity gains from AI-based tools, Nvidia’s growth rate is starting to plateau — and both analysts and Nvidia’s leadership anticipate it will slow even more in the final two quarters of FY24:
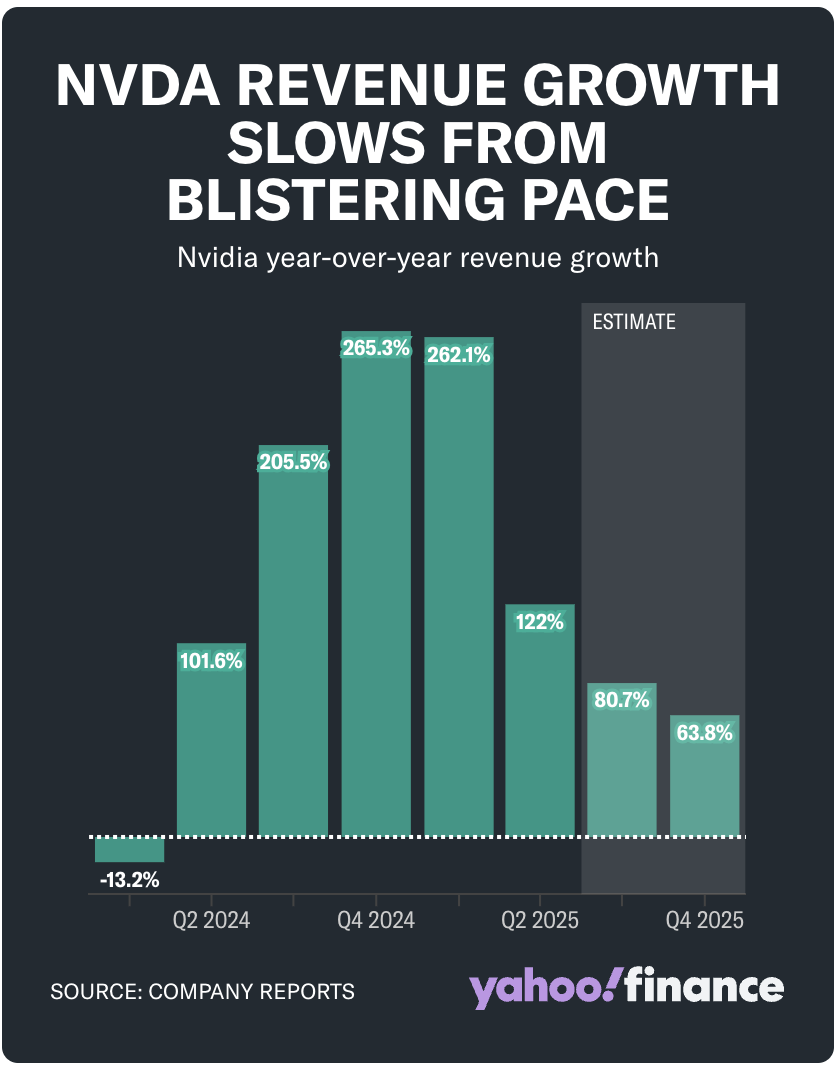
This spells trouble for Nvidia’s market cap, which is now on life support (despite holding steady today at $2.90 trillion). If we see the contraction down to a more typically Tech PE ratio, one would expect a precipitous drop from $120/share down to $60/share — possibly in the near future.
In closing…
I’ll just leave you with some other historical charts I made.
Below, I’ve stacked the charts for Intel and AMD (the two major players for the CPU revolution during the dot-com bubble) starting in July 1996, on top of the current chart for NVDA (the major player for the GPU revolution during current AI bubble) starting in July 2020:
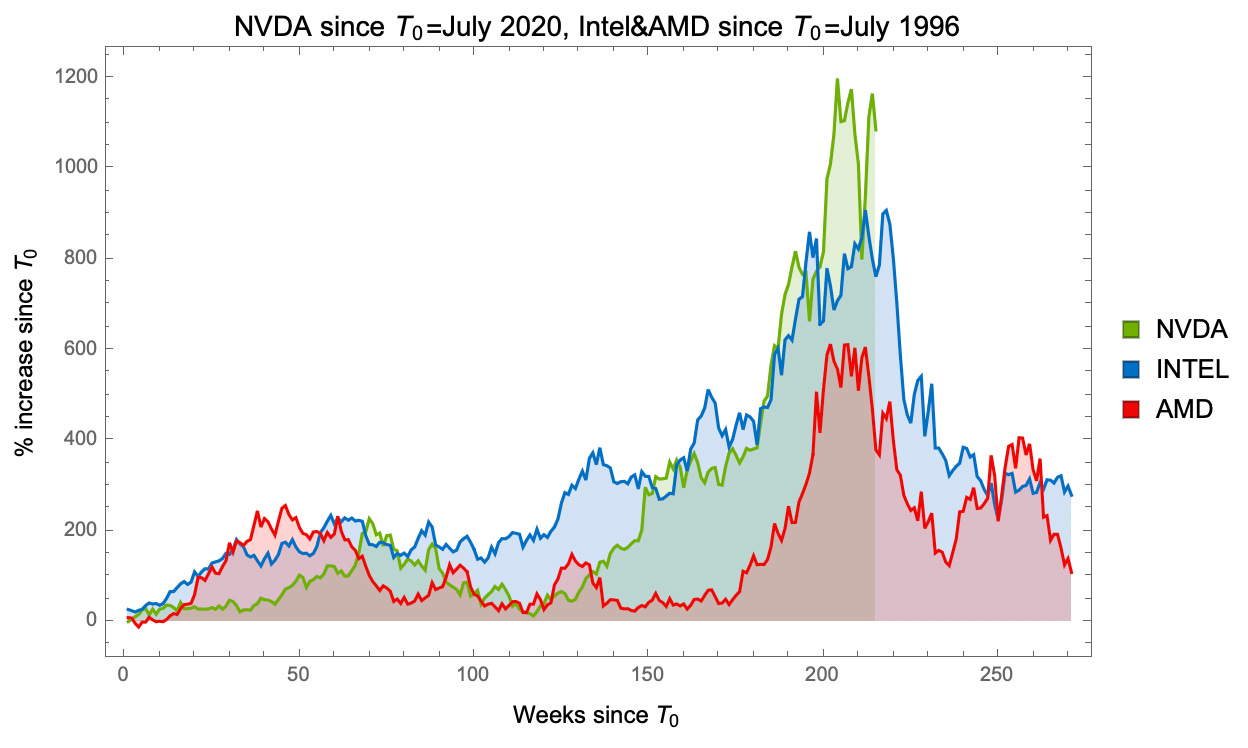
Within 60 weeks after the peak, both Intel and AMD lost 75% of their market cap from the summer of 2000.
It is also important to note that, similar to today, the Fed began cutting rates back then in response to rising unemployment. With borrowing costs at new lows, back in 2001 there was a significant shift of investor money away from inflated Internet stocks and into small-cap companies.
While I’m not predicting a market crash following the upcoming rate cuts — indeed we could still see a soft landing — it’s important to consider that the combination of slowing growth rates for a hardware company like Nvidia, along with a growth-stock-level P/E ratio has been seen before.
Intel and AMD, as shown in the charts above, offer valuable lessons for what Nvidia might face going forward. These two companies will also be central to this weekend’s newsletter, where we’ll explore the broader context of the U.S. chip industry.
This is Math Meets Money.