


Daily Brief: How the Great Depression is Hiding in Plain Sight
Daily Brief: How the Great Depression is Hiding in Plain Sight
There's a lot of room at the bottom - we just need a better sense of scale.

This daily brief was born out of a conversation I had with a friend about one of my favorite small cap growth stocks, TransMedics (TMDX). TMDX is one of the poster children of the Russel 2000 that has seen ridiculous growth over the past three years. Behold:
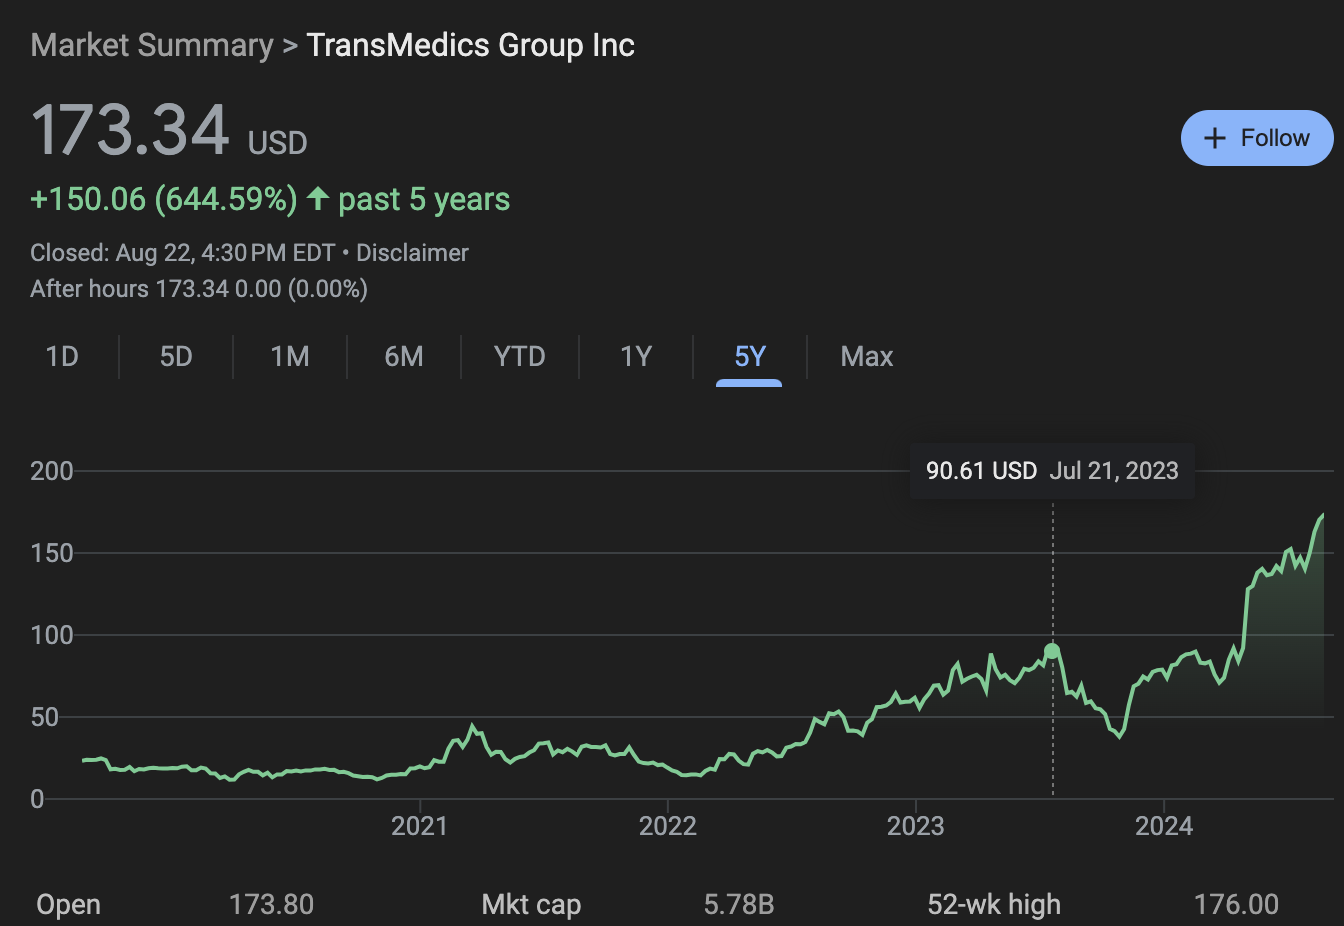
TLDR; little biotech company has sustained 35% quarter-over-quarter (Q/Q) growth in revenue for like 3 years straight. It has done so by creating a device that can fly hearts and other organ donations across the country.
By itself, that’s pretty epic — but then they had this insane insight about the organ donation market:
Organ donation market isn’t just about breakthrough biotech (again, which they nailed), it’s actually….
A logistics market (yeah, like Fedex, DHL, etc.)…
so in Q3 2023, they bought a frickin’ airline (like what?!),
and then they did this:
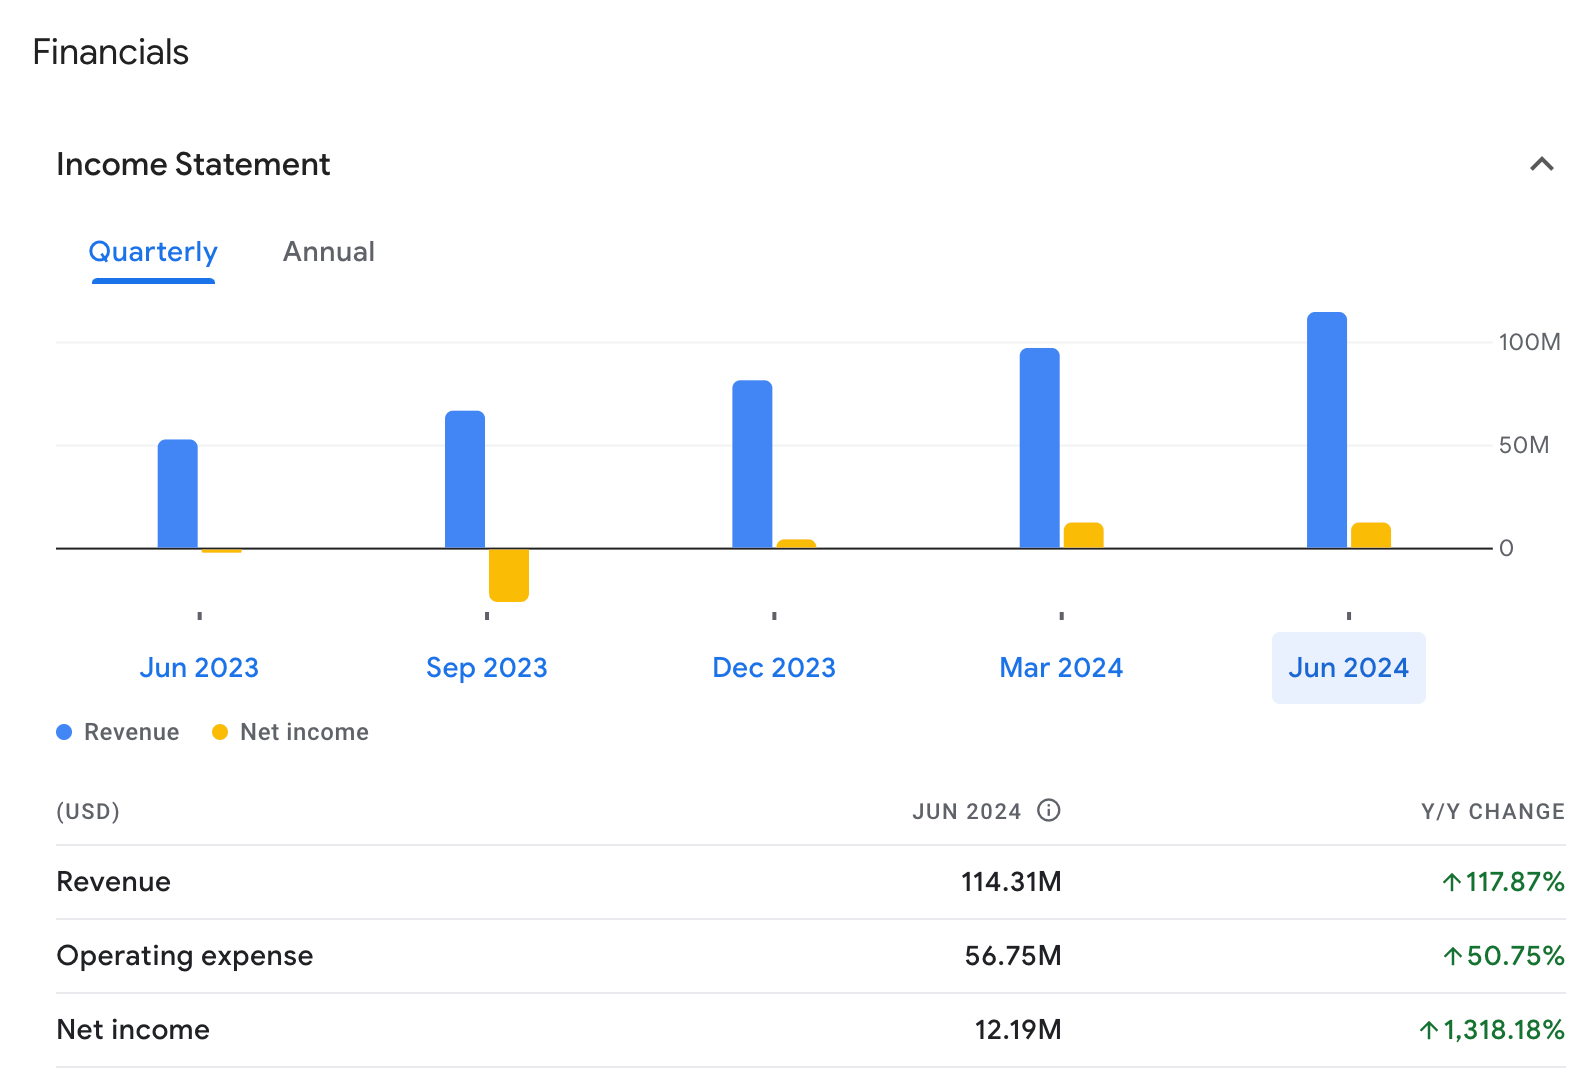
Now that, is what I call a beat & raise!!
But anyway, this Daily Brief isn’t about my praise for TMDX’s operations and strategy — but rather about an innocent, but very deep, comment my friend pointed out about the ticker chart above — and I quote:
It’s wild, from this chart it feels like I would have preferred to buy at the dip when they bought that airline1, but I actually would have been better off just buying in 2022, and selling even after the stock dropped when they reported being deeply unprofitable.
(Shown below)

And this brings us to the actual point of this Daily Brief:
Humans see the world in linear scales, and we have absolutely zero intuition by sight for exponential growth!
So let’s remedy this.
By using the correct sense of scale to understand how business engines grow their revenue, we’ll learn two key insights:
We should all invest in index funds not only because they grow consistently, but also because they never drop by more than a factor of 2
With the right sense of scale, the Great Depression is hiding in plain sight in the historical ticker data of the S&P 500.
As we’ll see, to quote Feynman:
So we go.
Building on some Human Intuition for the Miracle of Compounding
So my friend’s passing comment actually touches something very deep about humans, and frankly all physical systems, and how we perceive and operate within them.
Namely, we are very good at moving at a constant rate through space and time, but have essentially no reason to understand things that move between different orders of magnitude.
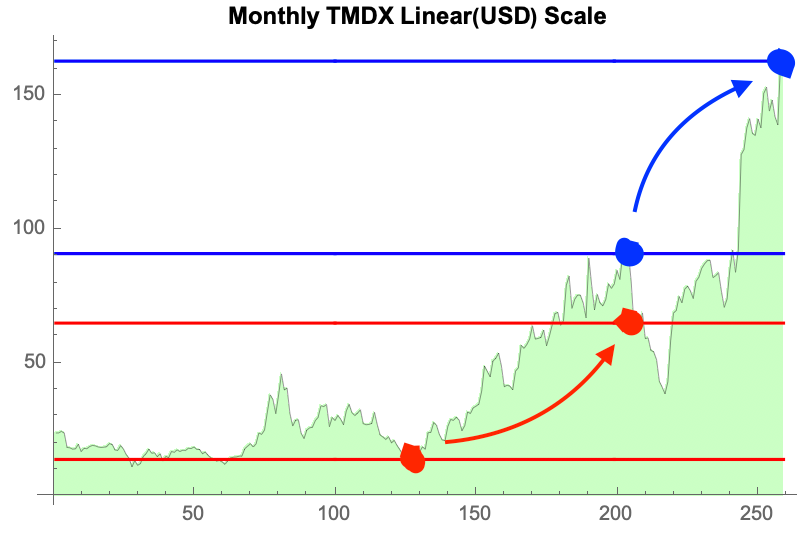
In science and math, we use logarithmic scales to remedy this shortcoming in our intuition. Behold, take a look at a normal plot of TMDX (that I made with some Wolfram code):
and another one I made in a base 2 logarithmic vertical scale
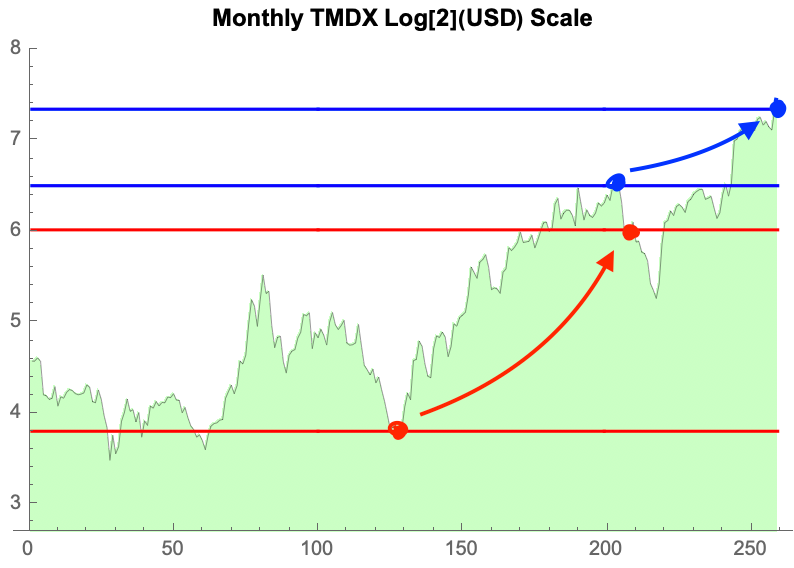
To recover the first plot, just take the vertical axis, Y [USD], and exponentiate, 2^Y [USD]. Now, you can really see that indeed, it would have been better to buy in 2022 and cut your loss after they bought the airline — just as my friend noted!
This brings us to this newsletter’s first 2 Rules of Money:
Rule 1: Money scales exponentially in time (up or down — but hopefully up)
Rule 2: What you can do with money, scales logarithmically.
Simply put, a companies with $0.75B, $1B and $1.5B are effectively the same — but companies with $1B (small cap), $10B (mid cap), and $100B (large cap) are in different universes!!
Amusingly, this property of being able to classify and distinguish between different systems by their orders of magnitude is essentially just effective field theory (EFT) - which happens to be a subject I know a little about.
Explaining what the hell EFT is will require a bunch more newsletters — and maybe a few quarterly deep dives — who knows. But essentially, it just has to do with being able to study a subsystem of the universe very effectively when it is much smaller and/or much larger than the stuff you don’t care about.
I was first introduced to this concept - that different scales are essentially different universes - as a middle schooler when I watched in this video (which I think was every was every 7th grade science teachers favorite excuse to take a nap) - and now I research it professionally :)
For our purposes, we can use it to really understand why everyone just should take their cash out from under the mattress, and just put it in an S&P ETF. With that….
Let’s find the Great Depression
So lightning review:
Logarithmic scales show us how things grow exponential curves to lines.
This allow us to see how stocks, assets, and companies compound their growth, but
without abandoning our deeply held intuition for moving at constant rates.
Now let’s check out the S&P 500 going back to the election of FDR, the first edition (1932):
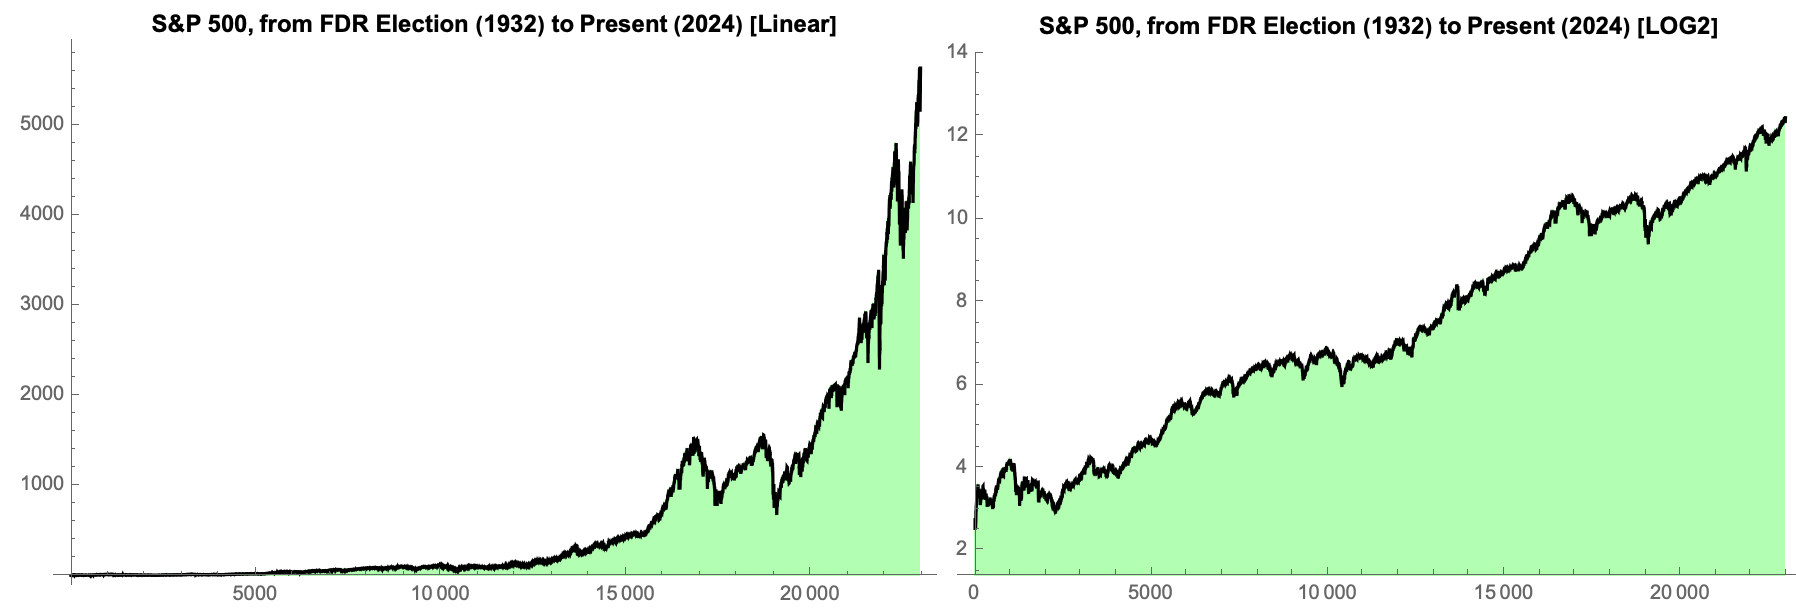
Nothing fancy here: left panel is what you would see on Yahoo finance going back to 1932, and right panel is the same but in log2(Y) on the vertical. The horizontal is in days.
Key Insight:
The S&P rises consistently, doubling about every 9 years. But more intriguingly — since 1932 — the S&P has NEVER fallen by more than about 50% — i.e. only one-order of magnitude MAX in a base 2 scale.
Now that’s what I call risk off!! Let’s take a closer look at some of the most turbulent epochs in the past 100 years of US History:
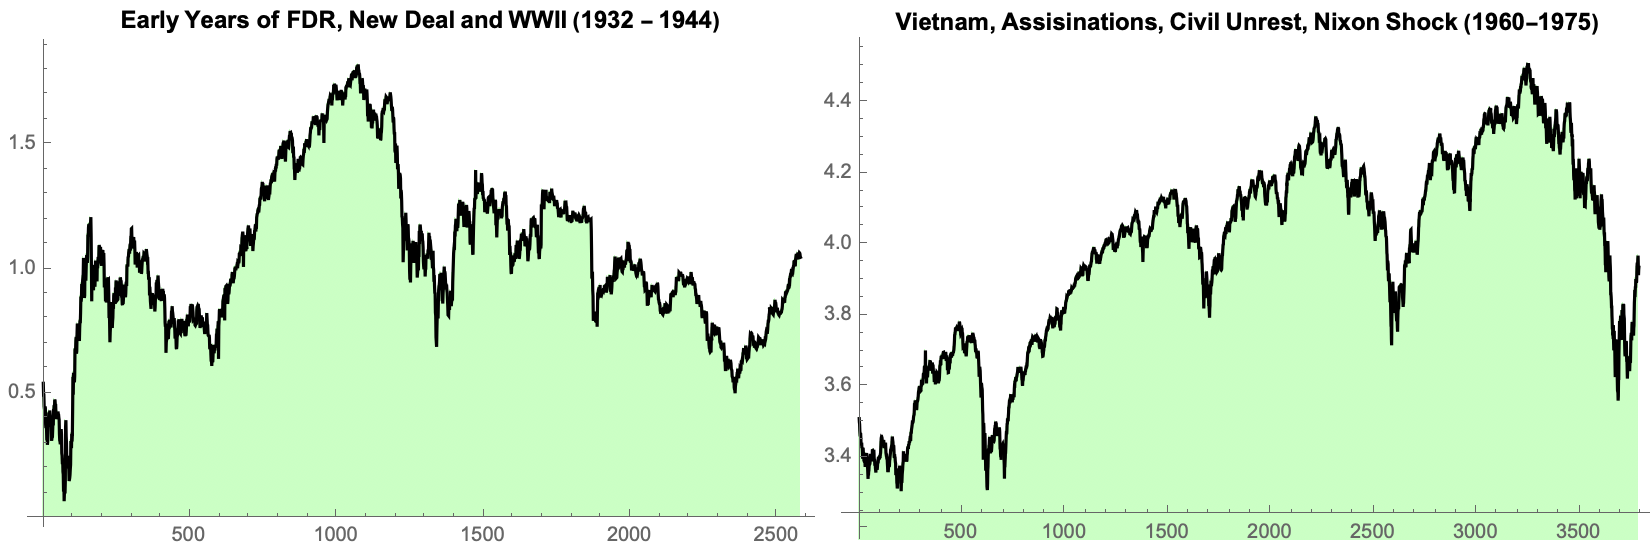
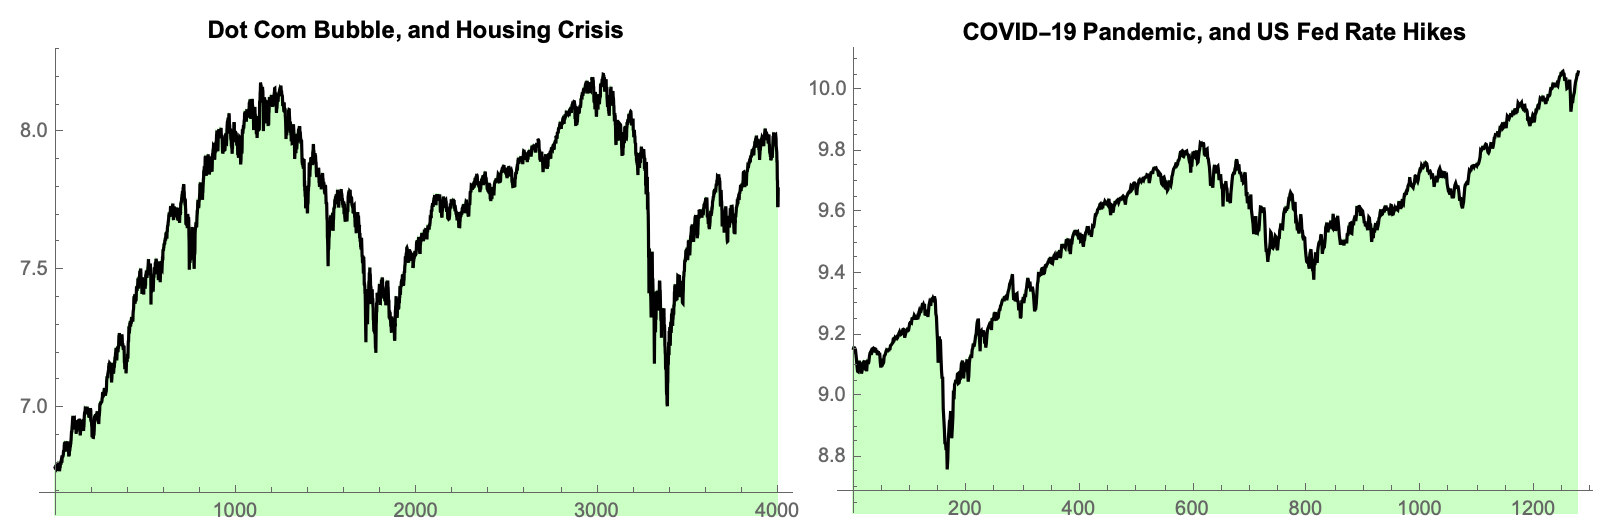
As you can see for yourself on the vertical scale — no drops ever exceeded more one order of magnitude in a log base 2 scale (i.e. 50% drop max).
However, there’s a small caveat to this. Some of the finance enthusiasts in my Subs might remember that the S&P started in 1923… and of course, if we add that back in we find the Greatest Market Crash of them all:
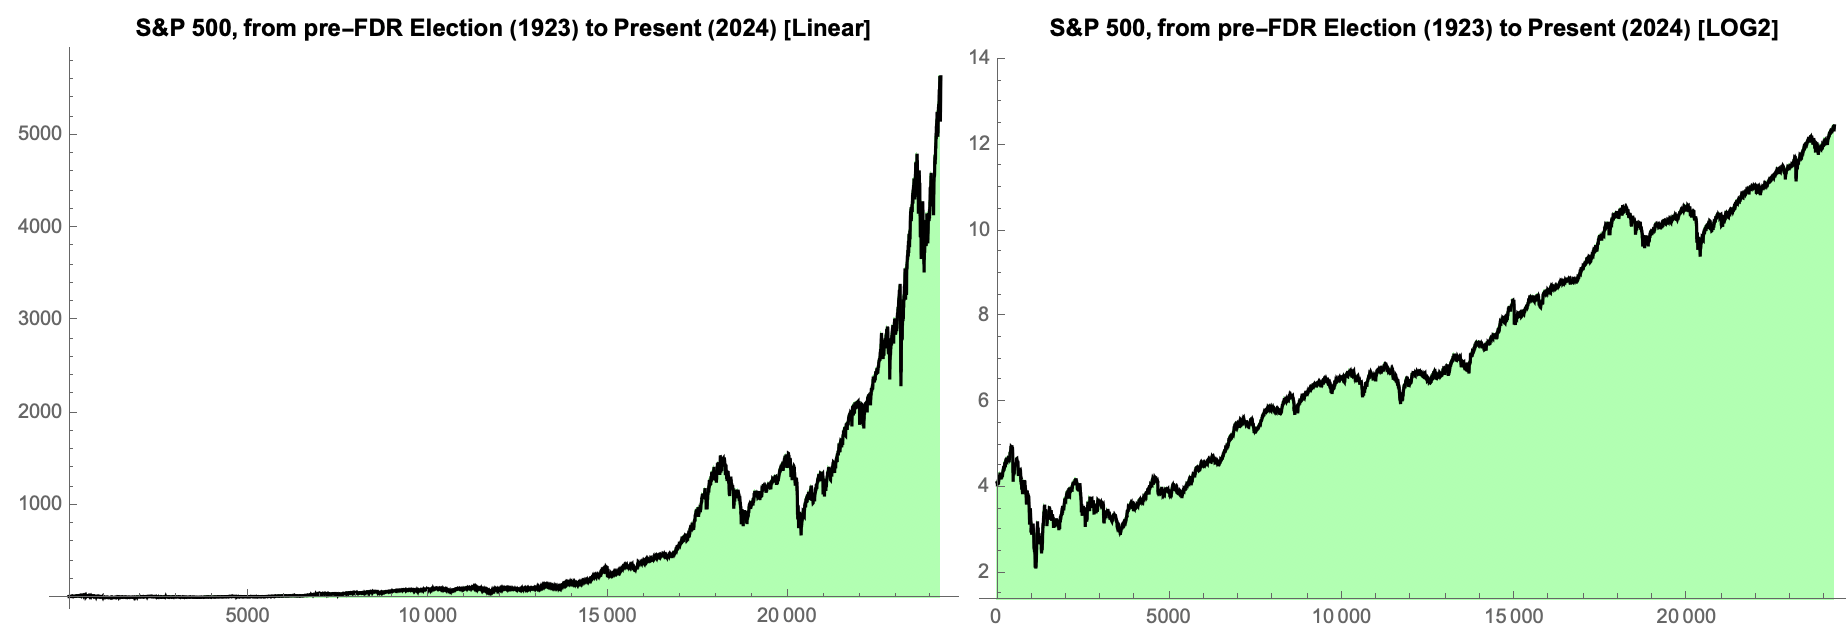
And there it is! As promised, hiding in plain sight at the bottom right corner! We just needed to rescale our perspective :)
Now if we zoom in, we find something rather unsettling:
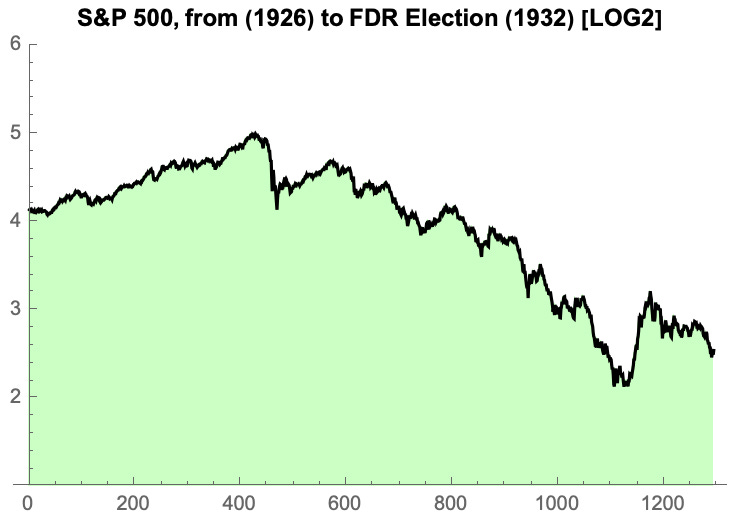
Yep. You read that right. That’s a drop by over 3 orders of magnitude.
When I realized this — that the crash of 1929 was like stacking the three worst dips of last 100 years on top of each other — I had to pull the article and check something real quick (which is why this newsletter is so late tonight - my apologies).
This is what I found.
Are we heading to the next Great Depression?
I wanted to build a small regression model to see where we are relative to the peak of 1929. So I took the S&P on the log scale and ran a linear regression and plotted the lines that bound the 95% confidence level (CL).
Here’s what I got:
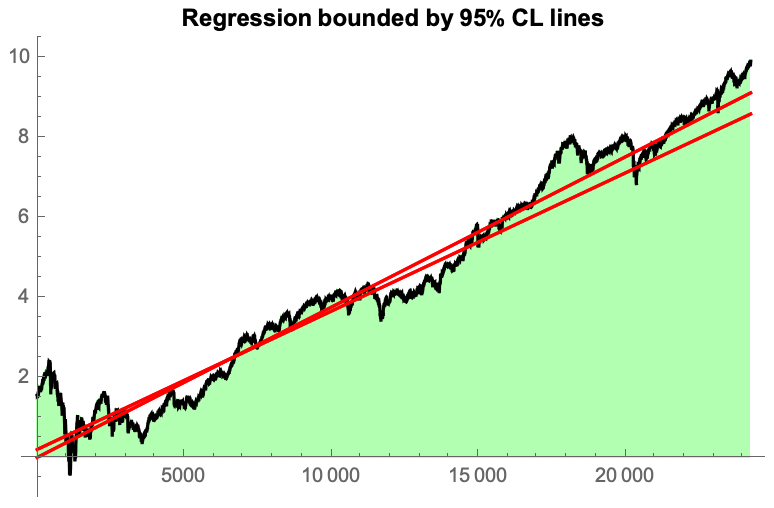
If we rotate this plot and measure the S&P relative to the regression we find the following:
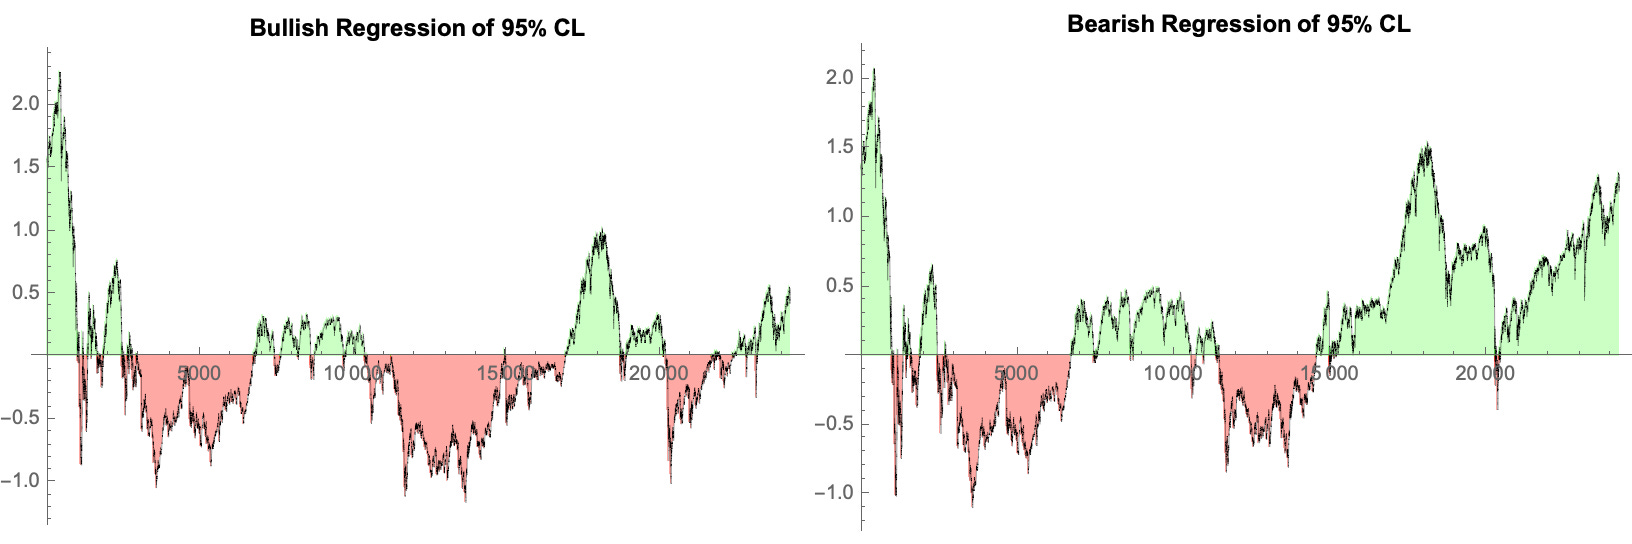
Which is honestly a little frightening — the left panel seems like we’re in a pretty standard cycle and very far away from the levels of 1929.
But the right panel looks like we were flirting with disaster during the dot com bubble and the housing crisis and now we’re right back where we started at the turn of the century.
Not to mention the growing national debt, monopolistic tech companies and soaring wealth inequality….
So we’ll see how this unfolds. Whatever happens, I’ll be here — analyzing the money for all of you with some math. Thanks for tuning in :)
This is Math Meets Money2.
Again, absolutely baller move.
Is this my new sign off? Am I the Walter Cronkite of Substack???