


Daily Brief: Professional Services ranked by Gini Ratio
Daily Brief: Professional Services ranked by Gini Ratio
Whether it's 1849 or 2024, it pays to sell shovels in California -- but for the rest of us, just own the power station.

Yesterday was a little indulgent, so I’m going to reel it in today. I’m sure you’ve heard of income inequality as measured across nations — but what about across specific industries?
TLDR; Here we describe what the top 5 professional services industries do for business engines — and then we rank them by their Gini Ratios using publicly available compensation data. Interested? Subscribe!
Want to learn more? Read on.
Professional Services 101
In a gold rush, the smart money isn’t digging for gold; it’s selling the shovels. As we’ve seen most recently with Nvidia, it pays to provide the infrastructure for a tech bubble.
Similarly, Professional services—banking, corporate law, accounting, and consulting—are the modern-day shovel suppliers. As I’ve learned, they are the essential infrastructure that powers and sustains the economy, just like utilities provide energy and clean water.
The top four/five such industries are as follows:
1. Banking: The Financial Powerhouse
Banks are the power stations of the economy, fueling business engine operations with capital and financial services. Without them, companies would struggle to grow, invest, or manage risks.
2. Corporate Law: The Legal Framework
Corporate law acts like a water utility, providing the legal clarity businesses need to operate safely. Lawyers help navigate regulations, protect assets, and prevent legal issues, ensuring businesses can run smoothly.
3. Accounting: The Economic Regulators
Accountants are the system’s regulators, tracking financial health, ensuring tax compliance, and providing critical data. They keep businesses financially sound and compliant, and are close cousins of…
4. Management + IT Consulting: The Strategic Advisors
Management and IT consultants are the strategic engineers, guiding businesses through challenges and driving innovation. They help companies adapt with the power of MECE, ensuring they stay competitive and efficient.
On a macro-scale, professional services industries look pretty much the same:
They all employ 2 - 9 million employees globally, and
They all generate about 400 billion - 2 trillion in ARR (annual recurring revenue).
So on a per capita basis, they all pump out the same productivity as measured in USD — about $200K / employee.
But here’s the kicker: not all shovels are created equal! In this Daily Brief I present what I found when exploring income-levels across professional services industries. The simplest way to understand how they differ is through their Gini Ratios.
Gini Ratios 201
The Gini Ratio/Index was developed by this guy. Think of Gini as a scorecard that shows us how evenly—or unevenly—income is distributed within a nation, industry or business.
Ranging from 0 (everyone gets the same slice of the pie) to 1 (one person takes the whole pie), the Gini Ratio1 gives us a glimpse into who’s getting rich and who’s just getting by.
To calculate the Gini Ratio:
List incomes in ascending order (from the least to most compensated).
Calculate cumulative income and cumulative population percentages.
Plot the Lorenz curve using these percentages.
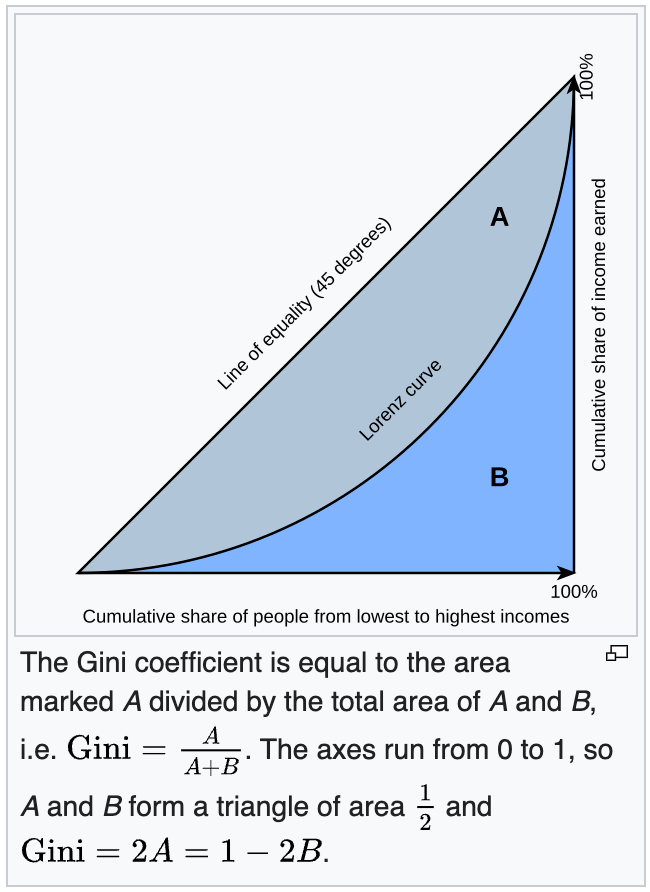
Then the Gini Ratio is the area between the Lorenz curve and the line of perfect equality, divided by the total area under the line.
The result is a number between 0 (perfect equality) and 1 (perfect inequality). Below is a good figure that shows this:
If you wanted to get really precise, given a distribution of incomes, p(x), with ‘x’ ranging from 0 USD to ∞ USD, then we can define Gini as a self-convolution of the distribution:
where the overall normalization is just the mean income of the distribution:
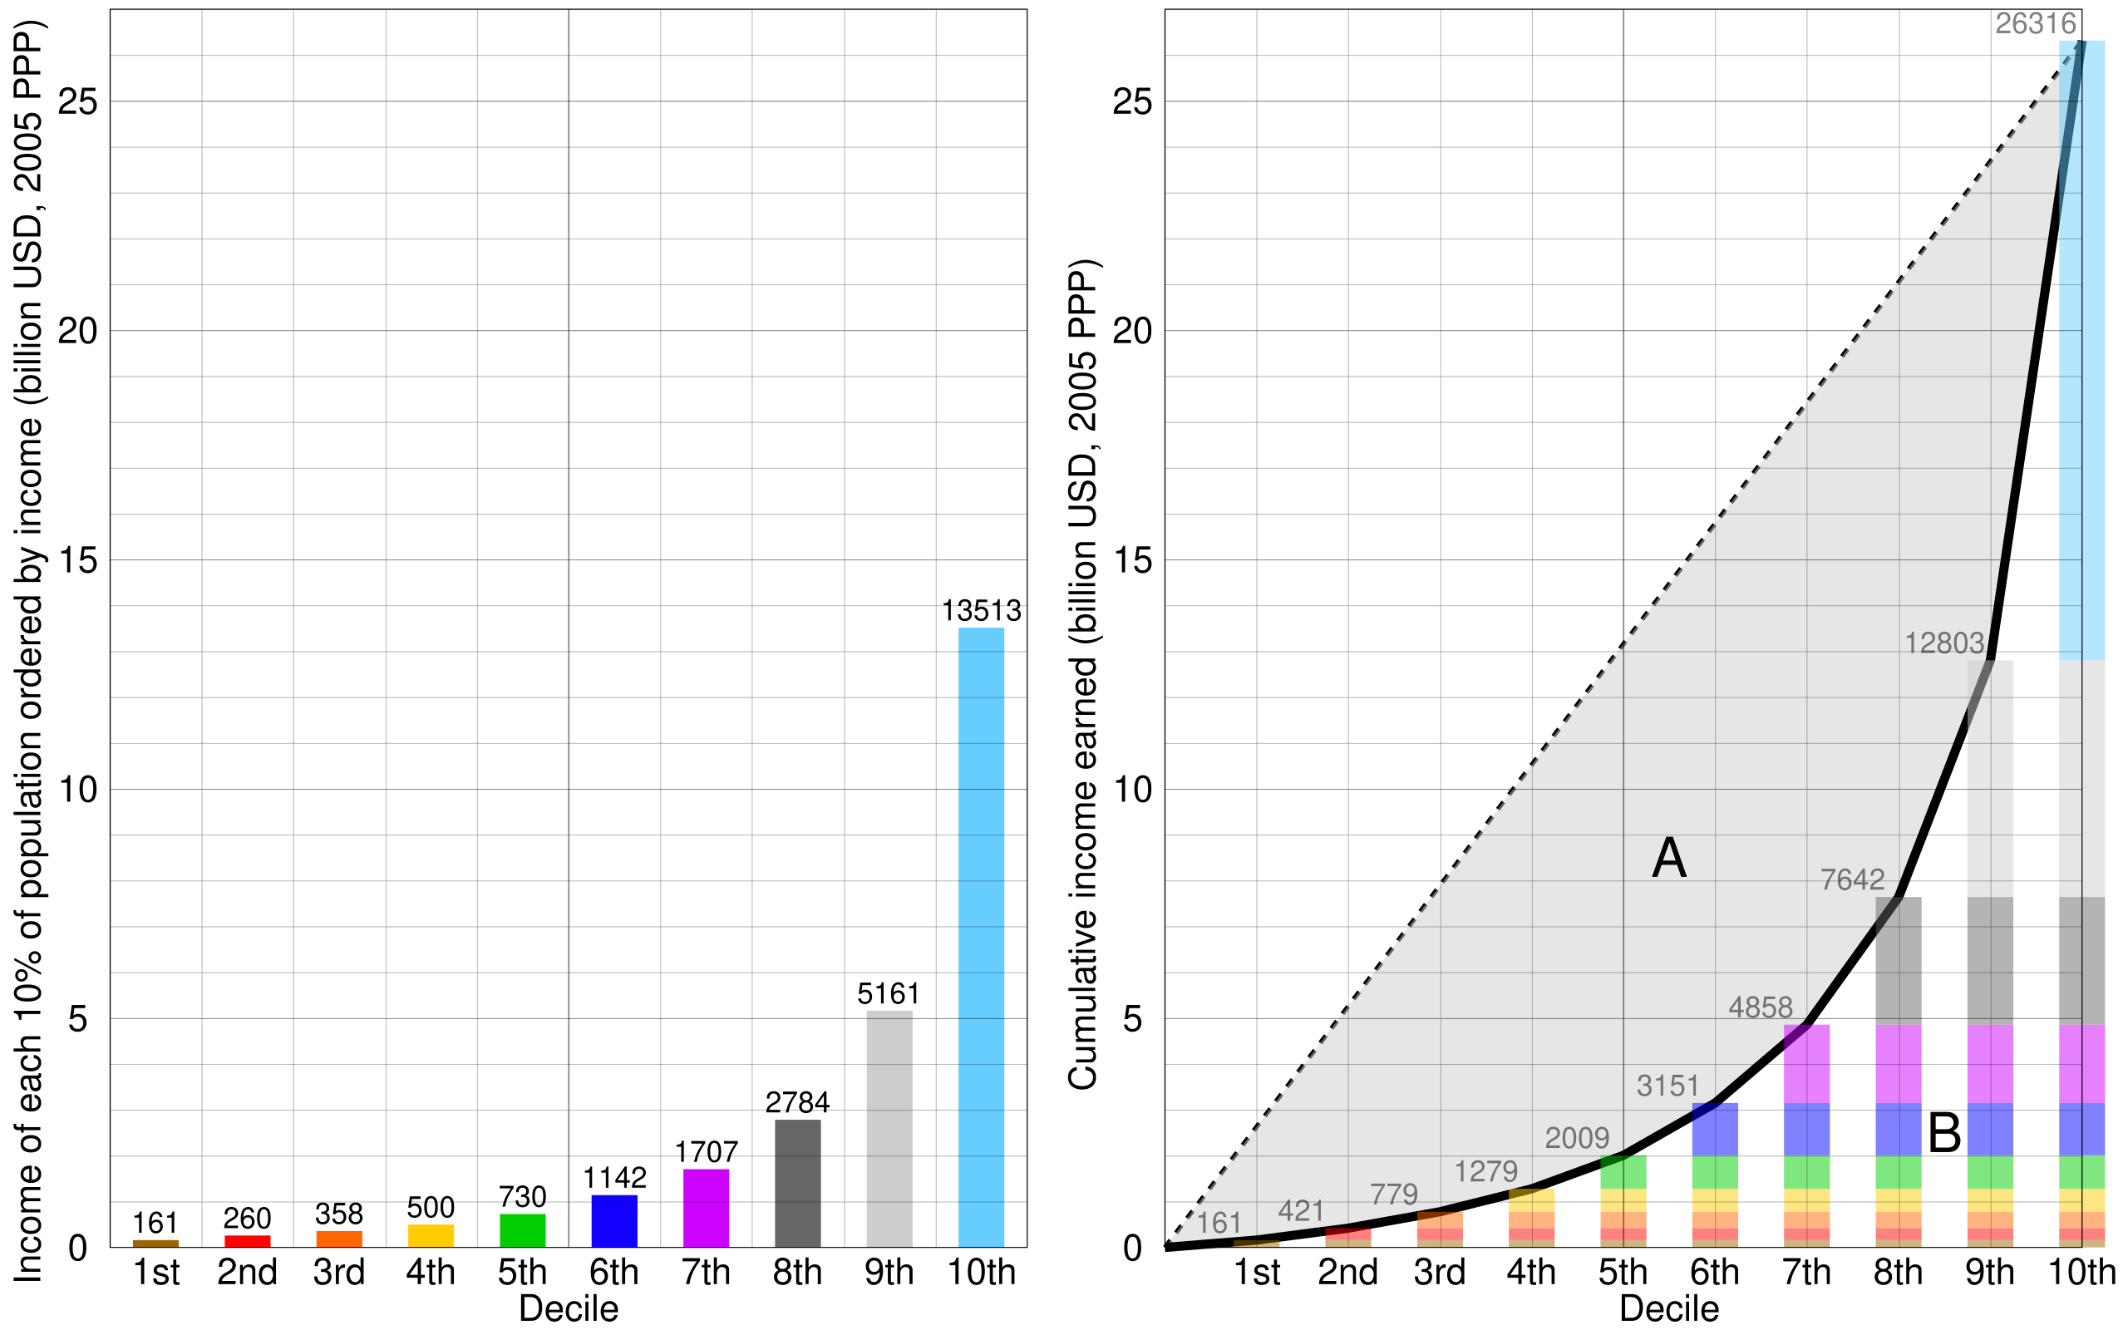
In practice we don’t go around integrating over continuous spectra of incomes, so to make a good approximation we can bucket all incomes by deciles (0% - 10%, 10% - 20%, 20% - 30%, etc.), with each bucket containing the total income acquired by each decile.
Connecting the dots…
This gives us a dividing line between the most equal (all income evenly distributed) and the most unequal (all income given to top, and only, earner). This can be seen below:
What economic factors are correlated with high Gini?
First let’s start with a couple intuitive factors for what controls :
Age - older people have more life/work experience, and tend to be more productive, and more capital gains from savings. They also tend to die, so there’s typically fewer seniors2 with more wealth leading to inequality in net worth and income.
Education - as we mentioned in the business engine newsletter, human capital and labor productivity help drive the efficiency of capital ordering. So if you know cool things, like programming, physics and material engineering, you can efficiently order some capital!
However, there are also some unintuitive factors that control income distribution and drive inequality:
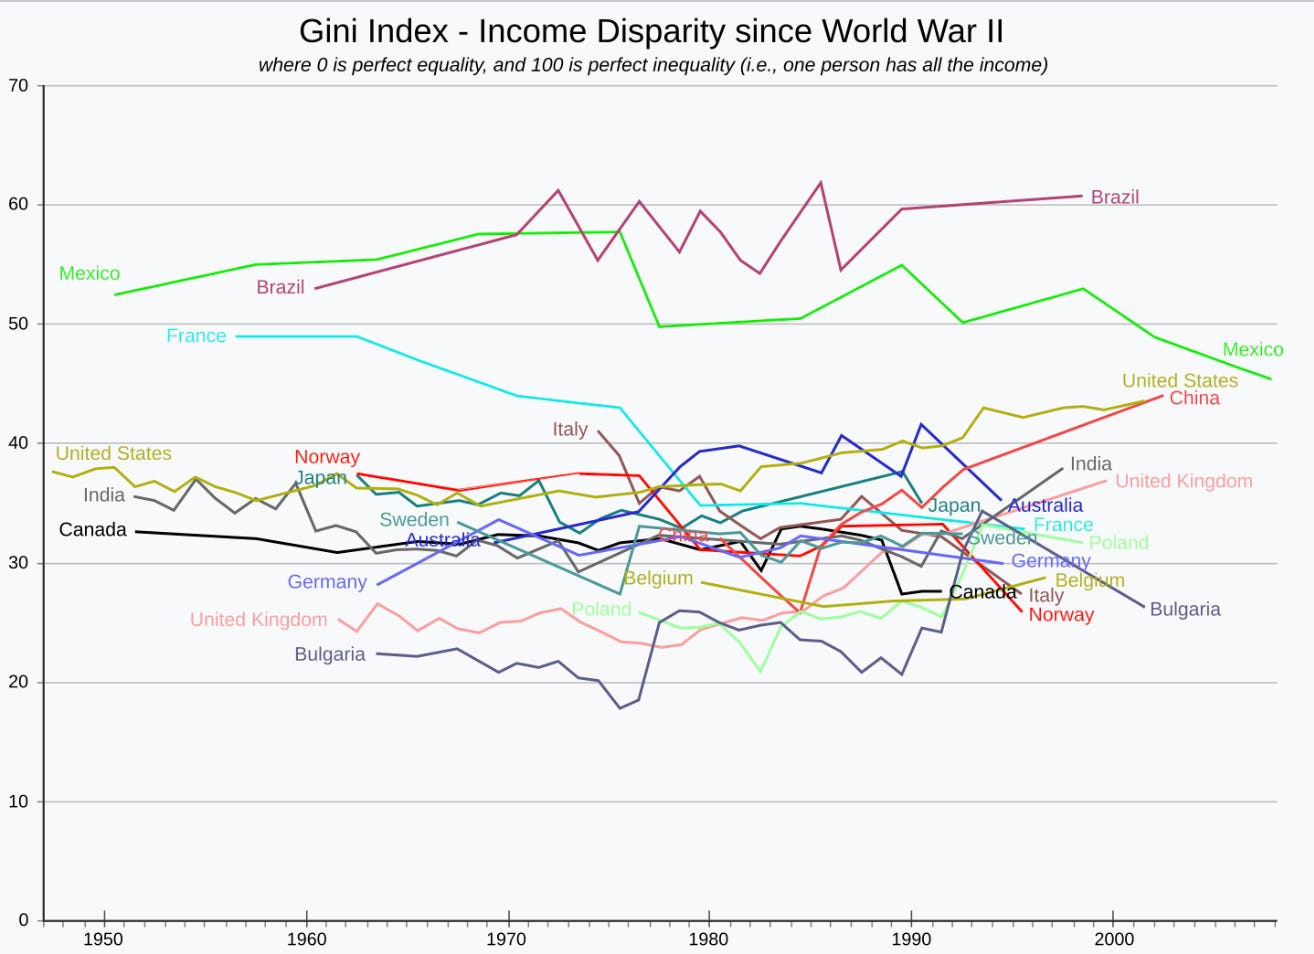
Population - typically (but obviously not always), the more populous a nation is, the more unequal it becomes (just take a look at Brazil, Mexico, the USA, China and India)
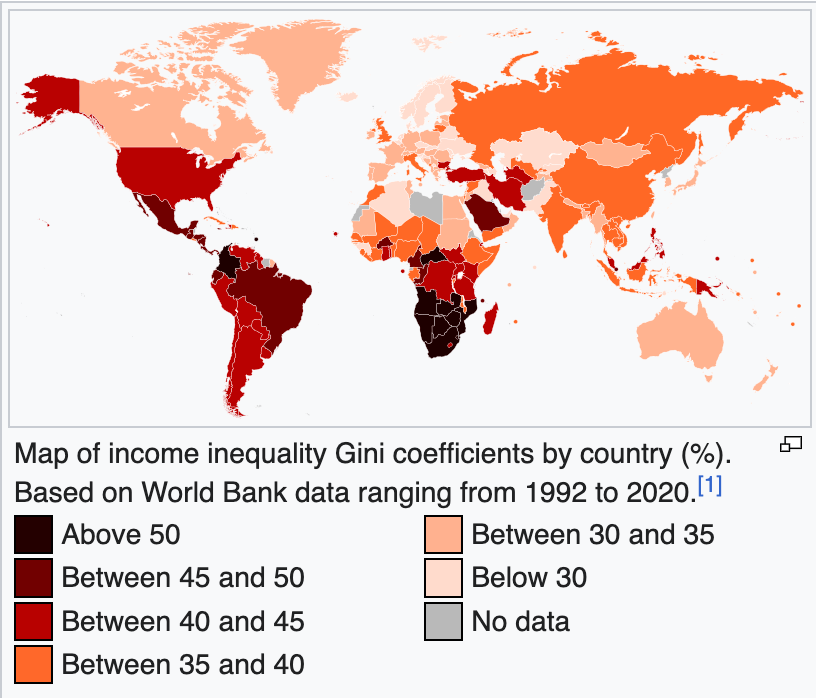
GDP - more interesting, both very rich and very poor countries tend to both be very unequal. I’ll leave my speculations about this for a later article - for now, check the heat map below:

Main Takeaway:
The Gini index measurement of inequality is almost completely controlled by outliers at the high-end — since outliers at the low end are weighted by their income (i.e. close to zero). Furthermore, outliers are more likely to occur in countries that are well resourced (large GDP) with many people (large population) that can flesh out the tail ends of the productivity distribution.
With that, can you guess how professional services stack up? Let’s take a look at the Gini Ratios for the top professional services industries.
Drum Roll…
Based on compensation data I’ve collected for each industry, this is what I can roughly approximate for their Gini indices (ranked from most inequality to most equal compensation):
Banking (Gini: 55 - 65)
Top Players: (JPMorgan, Bank of America, Goldman, CitiBank, etc.)
Global Annual Revenue: $1,500 Billion
Employees: 9 million globally
Corporate Law (Gini: 50 - 60)
Top Players:
Global Annual Revenue: $350 Billion
Employees: 1 million globally
Management (MC) + IT Consulting (ITC) (Gini: 40 - 50)
Top Players: (Bain, McKinsey, BCG, IBM, Accenture, etc.)
Global Annual Revenue: $850 Billion = $350B for MC + $500B ITC
Employees: 6 million globally
Accounting (Gini: 30 - 40)
Top Players: (EY, Deloitte, KPMG, PwC, etc.)
Global Annual Revenue: $600 Billion
Employees: 3-4 million globally
Some synthetic data analysis:
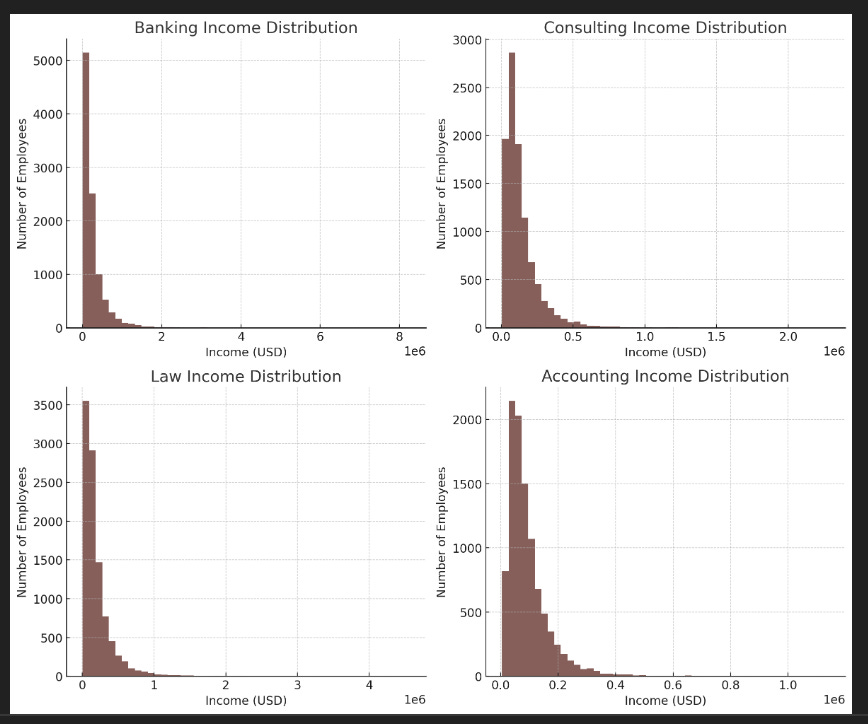
Using these rough approximations for Gini based on the income data I could find online, I wrote a little python script that generates representative income distributions by sampling, Pareto and log-normal distributions.
Here’s what I got:
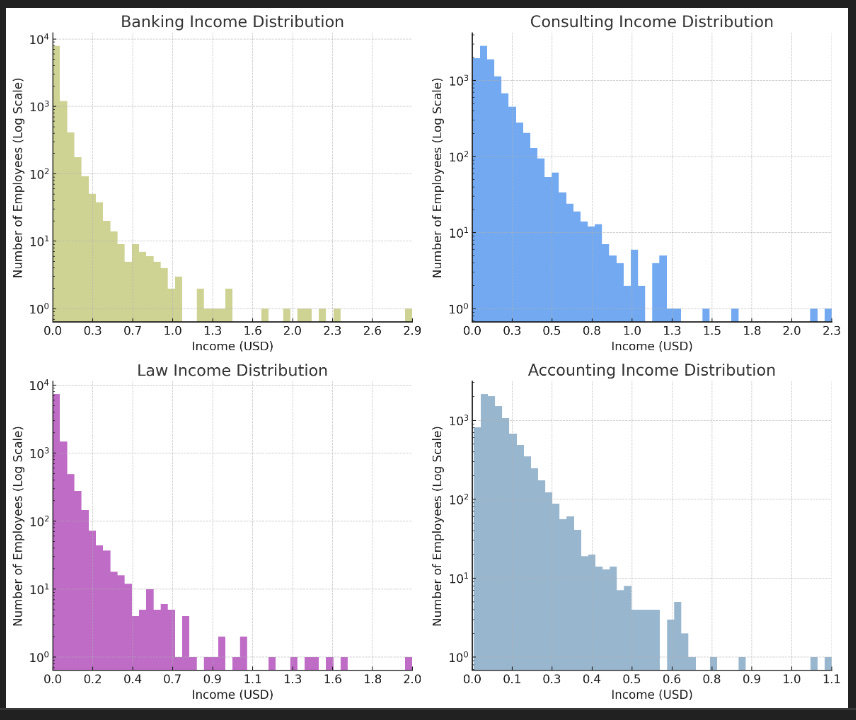
Rescaling the vertical axis to make it a log scale (which is more appropriate for the exponential and power law scaling of these distributions), you can see a candidate sample for the four industries:
Taking these samples, and stacking up the incomes from lowest to highest, we can fit a Lorenz Curve to the center points of the resulting histograms — and voilà! — we can easy produce the cumulative income distributions used to compute Gini indices for each industry:
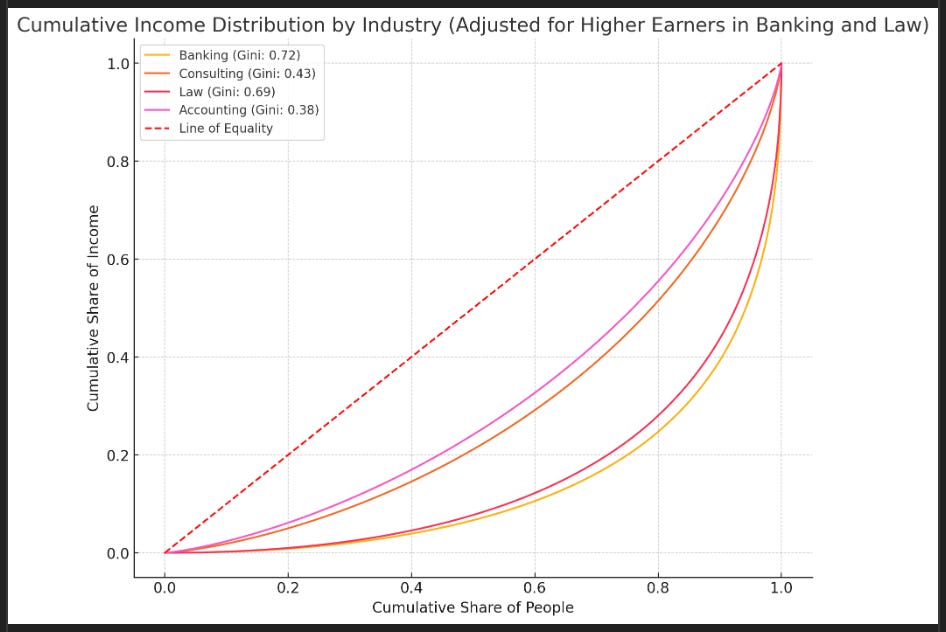
Consider how these compare to the plots and figures for national Gini ratios — does this make sense? Are professional services just wealthy nation-states? What do you think? Comment below!
If you liked this write up, considering subscribing to the newsletter!
What I call the Gini Index is just 100*Gini Ratio
On my way to getting kicked out of a career day for showing a Gini index chart to 3rd graders
Wondering if the management consulting firms are actually outsourcing much of their work - particularly in IT work. Do the other three sectors outsource like the MC firms? Is the Gini index for that sector for the consulting firms or for the overall consulting infrastructure? Isn't a much smaller fraction of management consulting talent corralling the wealth in this sector than in the other sectors? Thoughts?